
Understanding CalEnviroScreen: California’s Environmental Health Mapping Tool

LA, one of the impact zones of CalEnviroScreen: California’s Environmental Health.
CalEnviroScreen is California’s primary environmental health mapping tool — and one that plays a powerful role in determining which communities receive climate investments and regulatory attention. Because its scores influence funding, enforcement, and planning decisions, how the tool defines the state’s “Disadvantaged Communities” definition matters deeply.
CalEnviroScreen was designed to identify neighborhoods facing high pollution burdens and elevated health vulnerability. It combines environmental, demographic, and public health indicators into a cumulative score for every census tract in the state.
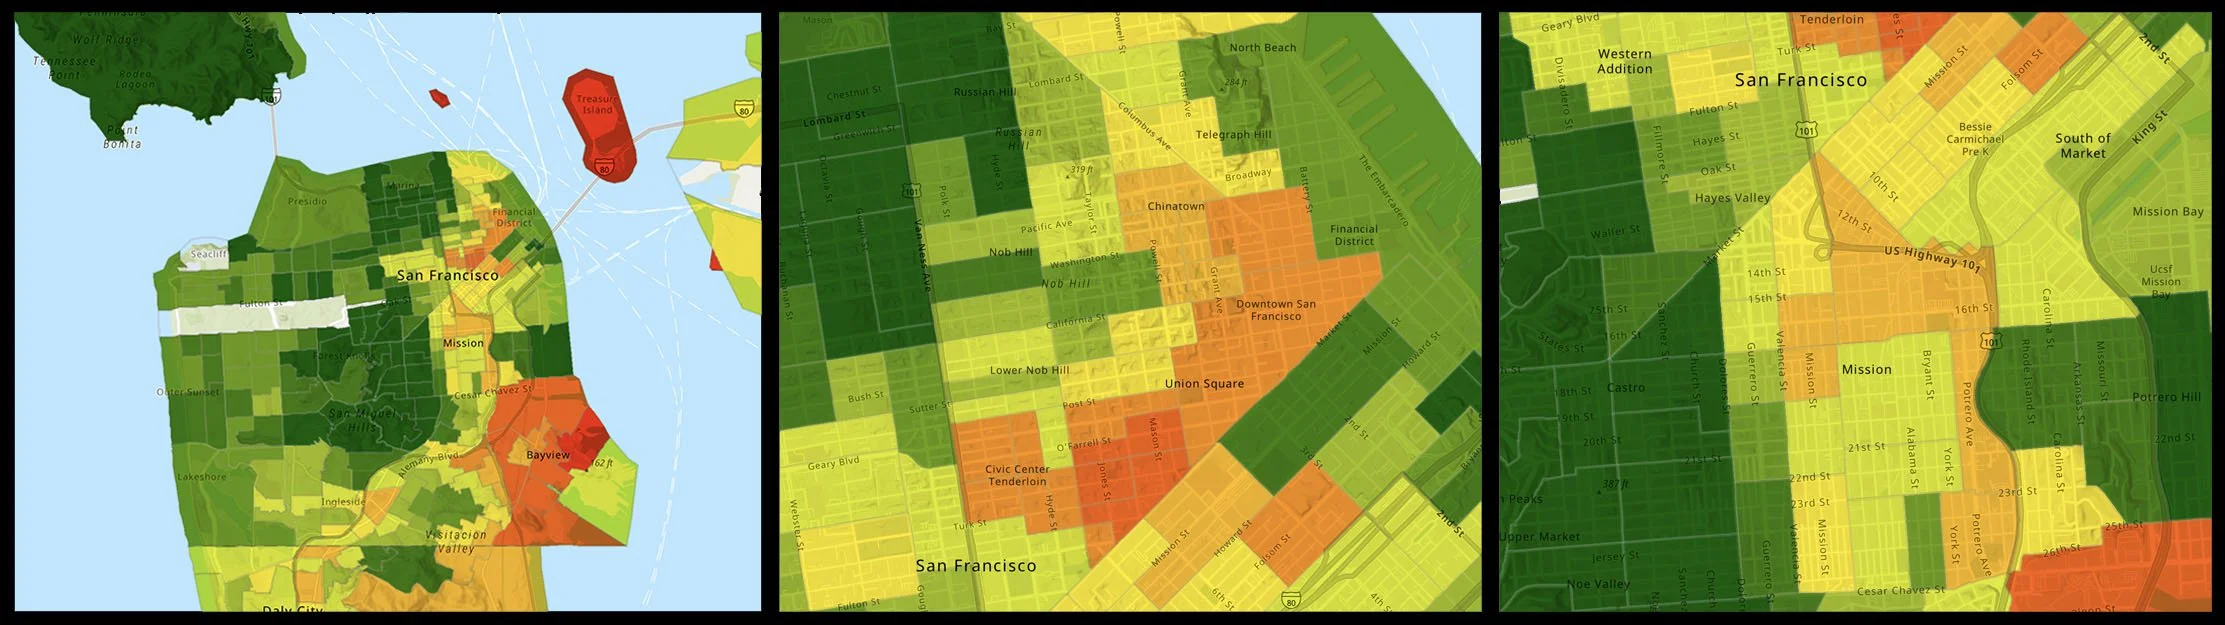
But as cities evolve and environmental pressures shift, the tool has struggled to fully capture certain realities — particularly in parts of the San Francisco Bay Area. When neighborhoods with layered pollution exposure and displacement pressures fall outside eligibility thresholds, it raises serious questions about how cumulative impacts and refinements are calculated.
We believe that mapping and environmental science should align more closely with lived experience and the communities most affected by environmental harm.
What is CalEnviroScreen?
CalEnviroScreen is a statewide screening tool that evaluates pollution exposure and population vulnerability across California census tracts. It generates a cumulative impact score and ranks tracts by percentile, which then informs funding eligibility and environmental policy decisions.
The tool is based on the principle that environmental burdens compound. Pollution does not exist in isolation; it interacts with poverty, housing instability, health conditions, and limited access to resources.
However, the structure of census tracts, indicator weighting, and percentile cutoffs can produce results that do not always reflect block-by-block environmental stress — especially in dense urban areas where industrial corridors, freeways, and ports intersect with residential housing.
A Science-Based Tool for Identifying Disadvantaged Communities
CalEnviroScreen uses data and established public health indicators to identify Disadvantaged Communities. It evaluates multiple environmental stressors rather than relying on a single metric.
Yet cumulative scoring depends heavily on which indicators are included, how they are weighted, and how geographic boundaries are drawn. Communities experiencing concentrated harm within mixed-income census tracts may not always appear in the highest percentiles.
As environmental justice tools become central to funding allocation, precisely mapping communities of need becomes more important than ever.
The Role of the Office of Environmental Health Hazard Assessment (OEHHA)
CalEnviroScreen is developed and maintained by the California Office of Environmental Health Hazard Assessment (OEHHA), part of the California Environmental Protection Agency (CalEPA).
OEHHA updates data, refines indicators, and releases new versions of the tool. Public comment and technical advisory processes contribute to revisions. Continued responsiveness to community concerns is essential to ensuring that updates address emerging gaps rather than entrench them.
The Purpose and History of CalEnviroScreen
CalEnviroScreen was created to provide a data-driven method for identifying communities disproportionately impacted by pollution. For decades, research showed that low-income communities and communities of color faced higher exposure to environmental hazards.
Addressing Environmental Justice and Health Inequities
The tool’s core purpose is to help direct climate investments, regulatory oversight, and environmental programs toward communities with the greatest combined burden of pollution and vulnerability.
When CalEnviroScreen functions effectively, it helps align environmental funding with equity goals. When it fails to fully capture certain neighborhoods — particularly those undergoing rapid demographic or land-use change — the result can be exclusion from programs designed to address environmental injustice.
Evolution of the Tool: From Version 1.0 to Draft CalEnviroScreen 5.0
Since its first release, CalEnviroScreen has undergone several revisions. Updates have refined pollution modeling, improved demographic data, and adjusted certain indicators.
CalEnviroScreen 4.0 represents the most recent iteration, but refinement is an ongoing necessity. Urban density, mixed-income census tracts, and localized pollution sources present challenges that require continual reassessment of how cumulative impacts are calculated. As California’s environmental landscape changes, the screening methodology has evolved alongside it, and yet gaps persist in Draft CalEnviroScreen 5.0, released in January 2026
How CalEnviroScreen Works: Data and Methodology
CalEnviroScreen evaluates each census tract using two major components: pollution burden and population characteristics. These are weighted and combined into a cumulative impact score.
Because eligibility for climate funding and environmental programs often depends on percentile rankings, even small changes in scoring can have meaningful consequences.
Understanding the Pollution Burden: Exposure and Environmental Effects
Pollution burden includes:
Exposure indicators, such as ozone levels, particulate matter (PM2.5), and traffic density.
Environmental effects indicators, such as hazardous waste sites, impaired water bodies, and pesticide use.
These indicators aim to measure environmental stress across communities. However, census tract averaging can sometimes dilute highly localized pollution corridors — such as major freeway adjacencies or port activity zones.
In dense cities, exposure patterns may vary significantly within a single tract.
Assessing Population Characteristics: Sensitive Populations and Socioeconomic Factors
Population characteristics include health and socioeconomic indicators such as:
Asthma prevalence
Cardiovascular disease
Poverty
Educational attainment
Linguistic isolation
Unemployment
These factors recognize that pollution harms communities differently depending on existing vulnerability.
At the same time, rapidly changing urban demographics can influence how vulnerability is measured. Mixed-income tracts may contain deeply vulnerable populations alongside higher-income residents, affecting how cumulative scores are calculated.
The Scoring Formula: How Cumulative Impacts are Calculated
CalEnviroScreen multiplies pollution burden by population characteristics to generate a cumulative impact score. Census tracts are then ranked statewide.
Tracts above certain percentiles are designated as Disadvantaged Communities for funding purposes under state law.
Because this threshold-based system determines eligibility, communities that fall just below a cutoff may be excluded from programs — even when residents experience significant environmental burdens. This dynamic underscores why continual review of scoring methodology is essential.
Who is CalEnviroScreen For?
CalEnviroScreen is used across multiple sectors.
State and Local Government Agencies
Agencies rely on the tool to allocate climate investments, prioritize inspections, and guide policy development.
Community Advocates and Environmental Justice Organizations
Community organizations use CalEnviroScreen data to support advocacy and funding applications. When mapping does not align with lived conditions, advocates often supplement state data with community-generated research.
Academic Researchers and Public Health Professionals
Researchers analyze CalEnviroScreen to study environmental health patterns and policy impacts. Many also identify areas where additional localized data may be needed.
Policy Makers and Urban Planners
Urban planners incorporate CalEnviroScreen into general plans and zoning decisions. Accurate mapping is critical to preventing further concentration of pollution in already burdened neighborhoods.
How CalEnviroScreen Has Been Used
CalEnviroScreen remains a central framework for linking environmental policy with equity goals. Its usefulness depends on its accuracy and responsiveness to emerging community realities.
Prioritizing State Investments and Grant Funding (Senate Bill 535)
Under Senate Bill 535, a portion of California’s climate investment funds must benefit Disadvantaged Communities identified by CalEnviroScreen.
Because funding eligibility depends on percentile rankings, ensuring that the screening process reflects actual cumulative impacts is critical to equitable distribution.
Identifying Areas for Regulatory Oversight and Enforcement
Regulators use CalEnviroScreen to focus compliance and enforcement efforts. Precise mapping helps ensure that oversight is directed where pollution burdens are highest.
Informing Local Land Use and General Plan Decisions
Local governments rely on CalEnviroScreen when evaluating new developments and infrastructure projects. When screening accurately reflects community conditions, it can help prevent additional environmental burdens.
Key Pollution Indicators Tracked
Air Quality: Ozone, PM2.5, and Diesel Particulate Matter
Indicators include ozone, fine particulate matter (PM2.5), and diesel particulate matter — pollutants associated with asthma, cardiovascular disease, and premature death.
Water and Soil: Drinking Water Contaminants and Pesticide Use
The tool tracks drinking water contamination and pesticide application to assess potential exposure risks.
Toxic Sites: Proximity to Hazardous Waste and Cleanup Sites
CalEnviroScreen measures proximity to hazardous waste facilities and cleanup sites that may pose long-term environmental health risks.
CalEnviroScreen plays a defining role in how California identifies environmental justice communities. As its influence grows, so does the importance of ensuring that it fully reflects cumulative impacts — particularly in dense urban neighborhoods facing layered environmental stress.
Strengthening the tool through thoughtful reform can help ensure that no community is overlooked and that environmental justice policy delivers on its promise.