How Open Data Empowers Communities: A Case Study in Eastern San Francisco
Published on EM Magazine in the A&E Journal
June 2025
Introduction
As wildfires disproportionately impact frontline communities, access to air quality data becomes increasingly important in protecting community health. For decades, Eastern San Francisco residents were concerned with the impact of poor air quality from wildfires and traffic emissions on low-income communities of color, but had no way to know what their neighborhood’s air quality was.1 This article will explore how open air quality data was used in Eastern San Francisco to 1) educate community leaders on air quality and disaster preparedness, 2) bolster community capacity to participate in decision-making spaces, and 3) advocate for increased resources and policy changes to improve air quality.
Limited Access to Air Quality Data
Air quality data and information are not equitably or readily available to low-income communities of color. In the case of Eastern San Francisco, residents and community groups have been concerned for years about poor air quality, especially in neighborhoods lined by highways, congested intersections, poor housing conditions, and industrial sites. This is particularly problematic for tenants of Single Room Occupancy (SRO) units, for whom indoor air quality is a major issue. SROs, primarily located in the Eastern San Francisco neighborhoods of the Tenderloin, Chinatown, the Mission District, and South of Market (SoMa), house low-income tenants in rooms as small as 8 by 10 feet, often with shared bathrooms and kitchens, and no heating, ventilation, and air conditioning (HVAC). SRO residents are comprised of a large immigrant population, with Spanish and Chinese-speaking monolingual elderly tenants.
As of 2021, San Francisco had an estimated 530 SRO buildings, housing around 18,000 residents, making SROs the densest form of housing in the city. Poor living conditions in SRO. Buildings lead to serious indoor air quality concerns, such as trouble keeping poor outdoor air quality out, mold from water damage, and humidity, among others. Since there are fewer low-cost air quality sensors in Eastern San Francisco, SRO residents lack precise information regarding air quality in their communities (Figure 1).4 Additionally, language barriers and limited internet access further hinder SRO residents from accessing air quality information. This inequality is exacerbated during wildfire events, like the 2020 North Complex Fires that turned the sky orange with air pollution in San Francisco.

Figure 1:The left and right images are from the Purple Air Map, a low-cost personal sensor network featuring the highest number of air quality sensors in San Francisco, which monitors PM2.5 levels. On the left, there is a noticeable gap in sensor coverage in the neighborhoods of the Tenderloin, Chinatown, and South of Market (SoMa). On the right, it is evident that a significant portion of Bayview Hunters Point is also undermonitored.
Pollutants in wildfire smoke—such as particulate matter, nitrogen dioxide, and black carbon, —are significant public health concerns. Over time, prolonged exposure to outdoor air pollution has a substantial effect on health, exacerbating preexisting asthma and chronic obstructive pulmonary disorder (COPD), increasing risk of arrhythmia, cardiac failure, and stroke. To properly prepare for a wildfire disaster and protect community health, community members must have access to near-real-time free localized air quality data and information. A community-level air quality network, run by a community coalition, can help bridge the air quality data gap.
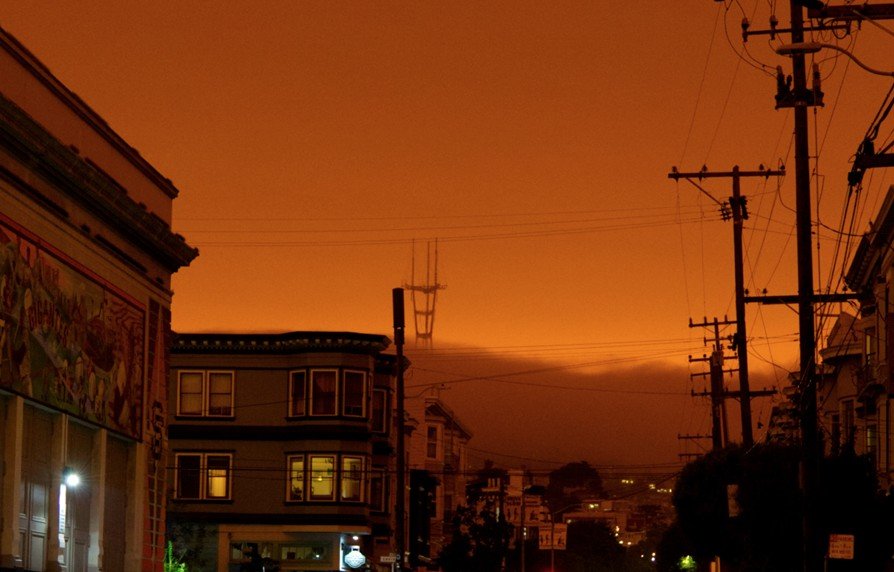
Figure 2: Wildfire smoke from the 2020 North Complex Fires that turned the sky orange in San Francisco. (Photograph taken by Brightline staff)
Empowering Community with Air Quality Data
To build a strong community air quality network, it’s essential to have a coalition of local leaders informing and shaping the process. These leaders bring lived experience and can identify where monitoring is most needed or currently missing. To achieve this, Brightline Defense, an environmental justice nonprofit in Eastern San Francisco, developed an air quality community leadership coalition to design the air quality network and build community capacity to engage in air quality decision-making.
This coalition is made up of community leaders from 3 groups; Tenderloin Housing Clinic's Central City SRO Collaborative (CCSROC) and La Voz Latina, and Community Youth Center (CYC). This coalition brought together SRO tenant organizers, Monolingual Spanish and Chinese-speakers, and youth leaders and was formed to specifically reach historically excluded Tenderloin, Mission, Bayview Hunters Point, and South of Market (SoMa) communities that have been disproportionately impacted by poor air quality. Through this community leadership coalition, Brightline conducted various community air quality needs assessments, utilizing interviews and canvassing efforts to gauge the community's knowledge and perception of air quality. Based on 250+ interviews and surveys, the coalition designed community air quality training programs and identified suitable sites after site surveys for community air quality monitoring.

Figure 3: Brightline’s Program Manager giving air quality training to La Voz leaders at the Tenderloin Museum on 9/19/25. (Photograph taken by Brightline Staff)
Workshops on air quality governance and public comment processes were also conducted, empowering community leaders to engage effectively with air quality decision-making, regional air quality agencies and share their lived experience.
Creating a Community-Level Air Quality Network
To address community concerns and better understand neighborhood-level air pollution, Brightline teamed up with local community, academic, and technical partners to develop and maintain a 19-sensor air quality monitoring network.
Based on community-reported issues such as traffic, construction, and wildfire smoke, Brightline opted to use Clarity Node-S sensors (Clarity Movement, Berkeley, CA, USA). These solar powered, air quality sensors measure particulate matter (PM2.5) and nitrogen dioxide (NO2) and are comparably low-cost when compared to government-grade air quality reference monitors. Reference monitors are generally much more expensive, ranging from $15,000 to $50,000, whereas low-cost sensors usually range from around $100 to $2,500 (EPA). Brightline and its partners finalized the monitoring sites by cross-referencing locations identified by the community. In September 2020, Brightline deployed sensors to provide community members with essential information about air quality levels. The deployment included 2 sensors in Chinatown, 7 in Bayview Hunters Point, 5 in South of Market (SoMa), 4 in the Tenderloin, and 1 in Potrero Hill. With technical support from Clarity Movement, Brightline provides a free public air quality data map where Eastern San Francisco community members can check the air quality in their locale in near-real-time (updated hourly). To help analyze collected data, Brightline teamed up with the University of California, Berkeley engineers with extensive experience with low-cost sensor networks to create air quality data reports for community leaders.

Figure 4: Clarity Node-S sensor installed above Portsmouth Square Park, Chinatown, SF. (Photograph taken by Brightline staff)
Brightline placed one sensor at the Bay Area Air District's reference site (where the District hosts San Francisco's only regulatory air quality monitor) to serve as an easy and accessible point of comparison to regulatory monitoring. Each month, the Brightline team analyzes the raw data collected by their sensor network and updates a Tableau dashboard where all past PM2.5 and NO2 data collected is summarized and viewable by neighborhood, timeframe, and pollutant.
Brightline developed air quality data workshops aimed at sharing with community members how to access near-real-time air quality data, review air quality trends, and how to prepare for poor air quality and wildfire smoke.
Together, these trainings and workshops bolstered community knowledge of air quality, complemented community members’ lived experiences with poor air quality, and introduced them to the correct channels to advocate for change. Below is an example of how this framework, all put together, can lead to meaningful change for frontline communities.
Leveraging Data for Change
In July 2023, Brightline, CCSROC, and La Voz Latina community leaders united to advocate for cleaner air and increased resources in Eastern San Francisco. One key resource that the coalition focused on was the Bay Area Air District's Home Air Filtration Program, which provides free air purifiers to frontline community members.
Brightline's community leaders found strong demand for this resource from SRO tenants but encountered some barriers to access in the first iteration of the program. To qualify, community members needed to be Medi-Cal beneficiaries, provide a doctor’s diagnosis of a respiratory condition, and participate in two health assessment Zoom calls. These requirements posed challenges for many SRO residents, who may lack internet or access to a doctor. Despite Brightline staff dedicating over 100 hours to assist applicants, less than 50% received an air purifier.
Equipped with data and insights into air quality decision-making, Brightline's community leaders effectively advocated for the removal of these barriers at the Bay Area Air District (Air District). During their public comments, leaders highlighted the pressing need for improved air purification and presented data trends and personal testimonies to support their case for change.

Figure 5: Brightline community leader, Miryam Aspajo (right) giving public comment at the Bay Area Air District with translation provided by Brightline Policy Fellow Nicole Gonzalez (left). ("Bay Area Air District Board of Directors Meeting," July 19, 2023, Bay Area Metro Center, San Francisco, CA, Video Recording,)
As a direct result, the Air District created a mini-grant for all James Cary Smith organizations serving frontline communities to apply for free air purifiers for distribution–effectively changing Air District policy. In Brightline's case, the community leaders received 150 air purifiers for Eastern SF community members, with no requirements. The community coalition then devised a distribution plan and outreach strategy within SROs to identify residents with self-reported respiratory issues.
A key aspect of the project was collecting post-distribution surveys, which revealed that over 90% of participants reported improvements in indoor air quality and health symptoms. While air purifiers are a temporary solution, they offer immediate relief to community members.
Conclusion– Lessons Learned
Data plays a crucial role in advocacy and can provide quantitative evidence of environmental injustice. Community air quality monitoring networks, along with strong coalitions, can advocate for policy changes, increase resources for cleaner air, and share disaster preparedness strategies. This will ensure that when the next wildfire affects the Bay Area, the Eastern San Francisco community can breathe a little easier.
Download our report to read more about San Francisco's Single Room Occupancy (SRO) communities that are disproportionately affected due to little access to indoor air filtration, personal protective equipment, preexisting health conditions, crowded living conditions, and growing wildfire conditions.
References
1 Brightline Defense Project, Little Room to Breathe Report: Evaluating Air Quality & Health Impacts in San Francisco’s Single Room Occupancy (SRO) Buildings. (July 2021). https://www.brightlinedefense.org/reports-and-publications/#aq
2 Zhai, Wei, et al. “Low-Cost Sensor Desert and Equity across US Cities - Wei Zhai, Xueyin Bai, Yijun Shi, Junqing Tang, Yu Shi, 2025.” Environment and Planning B: Urban Analytics and City Science, Sage Journals, 2025, journals.sagepub.com/doi/10.1177/23998083251325593.
3 San Francisco Department of Public Health, Single Room Occupancy Hotels in San Francisco - A Health Impact Assessment. (Spring 2016). https://www.pewtrusts.org/-/media/assets/external-sites/health-impact-project/sfdph-2016-sroh-report.pdf
4 San Francisco Chronicle. “California Air Quality Map: See Air Quality Near You.” California Air Quality Map, 22 June 2021, www.sfchronicle.com/projects/california-air-quality-map/.
5 U.S. Environmental Protection Agency. "Health Effects Attributed to Wildfire Smoke." EPA, U.S. Environmental Protection Agency, www.epa.gov/wildfire-smoke-course/health-effects-attributed-wildfire-smoke.
6 United States Environmental Protection Agency, Research on Health Effects from Air Pollution, (December 12, 2024). https://www.epa.gov/air-research/research-health-effects-airpollution#:~:text=Decades%20of%20research%20have%20shown,disease%20and%20other%20health%20problems.
7 U.S. Environmental Protection Agency. How to Evaluate Low-Cost Sensors by Collocation with Federal Reference Method Monitors. Office of Research and Development, Jan. 2018. www.epa.gov/sites/default/files/2018-01/documents/collocation_instruction_guide.pdf.