Environmental Justice Data

Brightline staff and SRO Tenant Leaders reviewing air quality data from the Brightline Air Quality Monitoring Program.
Collecting and presenting data on environmental and economic conditions in underserved communities is an important way to shine light on issues that often go unnoticed by policy-makers, industry developers, and more affluent neighbors. Brightline works closely with local community members to collect and share information that brings attention to living conditions and environmental justice issues in their neighborhoods.
Air Quality Monitoring: Addressing Data Disparities
Frequent wildfires in California have highlighted great disparities in the availability of air quality data between affluent and low-income areas of the state. The lack of data for lower-income areas means it is more difficult for these communities to know when their health is at risk or make the case for air quality improvement efforts.
To address these data gaps, Brightline established a community-driven air quality monitoring program with community partners Central City SRO Collaborative (CCSROC) and Community Youth Center (CYC) of San Francisco. Together, we provided information on air quality issues to Single Resident Occupancy (SRO) Tenant Leaders and Youth Leaders, and we deployed 19 air quality sensors in low-income areas of San Francisco. Air quality sensors are now located in South of Market (SoMa), the Tenderloin, Chinatown, and Bayview-Hunters Point. One of our sensors is co-located with the Bay Area Air Quality Management District (BAAQMD)’s air quality monitoring station in Potrero Hill to ensure quality assurance in our monitoring of localized air quality.
These small, self-sufficient monitors provide hourly information that Brightline has translated into an interactive data analysis platform Tableau for local residents. This online map allows both residents and researchers to visualize the data, and gain a better understanding of both the causes and impacts of poor air quality in their neighborhoods.

The Brightline Air Quality Monitoring Program uses Clarity Node-S sensors. These small devices are smaller than a shoebox and can be easily affixed to light poles and buildings. The Clarity Movement Node-S model comes with a solar panel and a cellular connection that minimizes the need for frequent maintenance and wirelessly updates air quality data on our open data map. Inside, laser light scattering technology and an electrochemical cell measures PM2.5 and nitrogen dioxide in the local air.
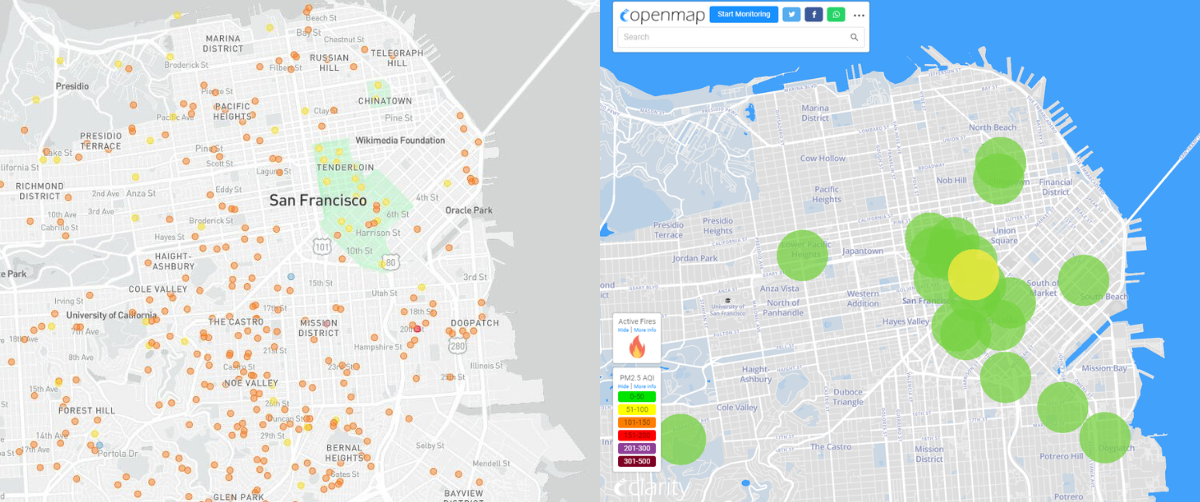
Images from the San Francisco Chronicle’s California Air Quality Map in September 1, 2021 primarily drew from PurpleAir sensors before incorporating Brightline’s network. Air quality sensors highlighted in green are Brightline Air Quality Monitoring Program sensors, filling gaps in the Tenderloin, Chinatown, and South of Market Street neighborhoods.
Realtime Air Quality Monitoring Map: